-1.png?width=1132&height=292&name=Asset%201@2x%20(12)-1.png "Odins.ai Logo")
How it works — The model
We build expert models — starting with what you already know
Most models start with a blank slate and ask the data to figure everything out. Odins starts with something better: what your team already knows about how marketing works. Then the data refines it. Here's what that looks like.

Your current budget IS a set of beliefs about what works
Think about it: when your team allocated 40% of budget to paid search and 15% to TV, that wasn't random. It reflected beliefs — about which channels drive results, at what levels, with what lag. Odins makes those beliefs explicit and testable.
We sit down with your team (typically 2–3 sessions), document what you believe about each channel's effectiveness, and encode it into the model as a starting point. Then the model tests each belief against 2–3 years of actual data — treating every historical week as an experiment.
Where your beliefs hold up, confidence increases. Where the data disagrees, the model adjusts. You end up with something better than either gut feel alone or a purely data-driven model that ignores your experience.

Every channel has a curve — and a point where more money stops helping
The first million you spend on a channel might drive strong returns. The next million less. Then less. This is diminishing returns — and it's the single most important concept in budget allocation.
Odins models a saturation curve for every channel, showing exactly where each one sits. Some channels still have room to grow. Others plateaued months ago. Without this, you're guessing whether the next euro spent will earn its keep.
Ads don't convert instantly — the model accounts for that
Someone sees your TV ad today and buys next week. Someone clicks a search ad and converts in hours. Each channel has a different lag between exposure and action.
Odins models these time-lag effects (called 'adstock') so the impact isn't just measured on the day the ad runs. TV might show effects over weeks. Search converts fast. Brand campaigns build slowly. The model captures each channel's unique time signature.

Marketing intelligence that drives growth


First, we strip out what isn't marketing
Sales go up in December. That's not your ads working harder — that's Christmas. Before measuring marketing impact, the model accounts for all non-marketing factors: seasonality, price changes, economic conditions, competitor moves, one-off events. What remains after removing these is the marketing contribution — and that's what gets attributed to channels.
- Seasonal patterns identified and isolated
- Price and promotion effects accounted for
- Economic and competitive factors modeled
- The 'baseline' is what happens with zero marketing

Each channel gets its own response function
The model estimates a mathematical function for each channel describing how spend translates to results. This includes the saturation curve (diminishing returns), the adstock (time lag), and overall effectiveness. These are estimated simultaneously — which matters because channels interact. Increasing TV might make search perform better. Cutting brand awareness might reduce all conversion rates. The model captures these relationships.
- Saturation curves model diminishing returns
- Adstock captures delayed effects
- Channel interactions modeled jointly
- Re-estimated monthly with new data

We tell you how confident the model is — not just what it thinks
Every estimate comes with a confidence range. If the model says TV drove 12% of sales, it actually means '10–15% with high confidence.' This matters. A channel with a wide band might need testing before you commit budget. A channel with a tight band is well-understood and ready for optimization. Hiding uncertainty doesn't make it go away — it just makes bad decisions more likely.
- Every estimate has a confidence interval
- Wide bands signal: 'test more before committing'
- Tight bands signal: 'well-understood, optimize confidently'
- Bayesian approach makes uncertainty quantification natural

The model doesn't just describe — it prescribes
Once the model understands each channel's response function, it answers the question that actually matters: 'given my budget, what's the best allocation?' The optimizer finds the mix that maximizes your outcome — revenue, leads, or profit — while respecting real constraints like minimum spend floors, contractual obligations, or channels you want to test.
- Optimal allocation for any budget level
- Respects business constraints (min/max/locked per channel)
- Shows the marginal return of the next euro per channel
- Updated monthly as the model learns
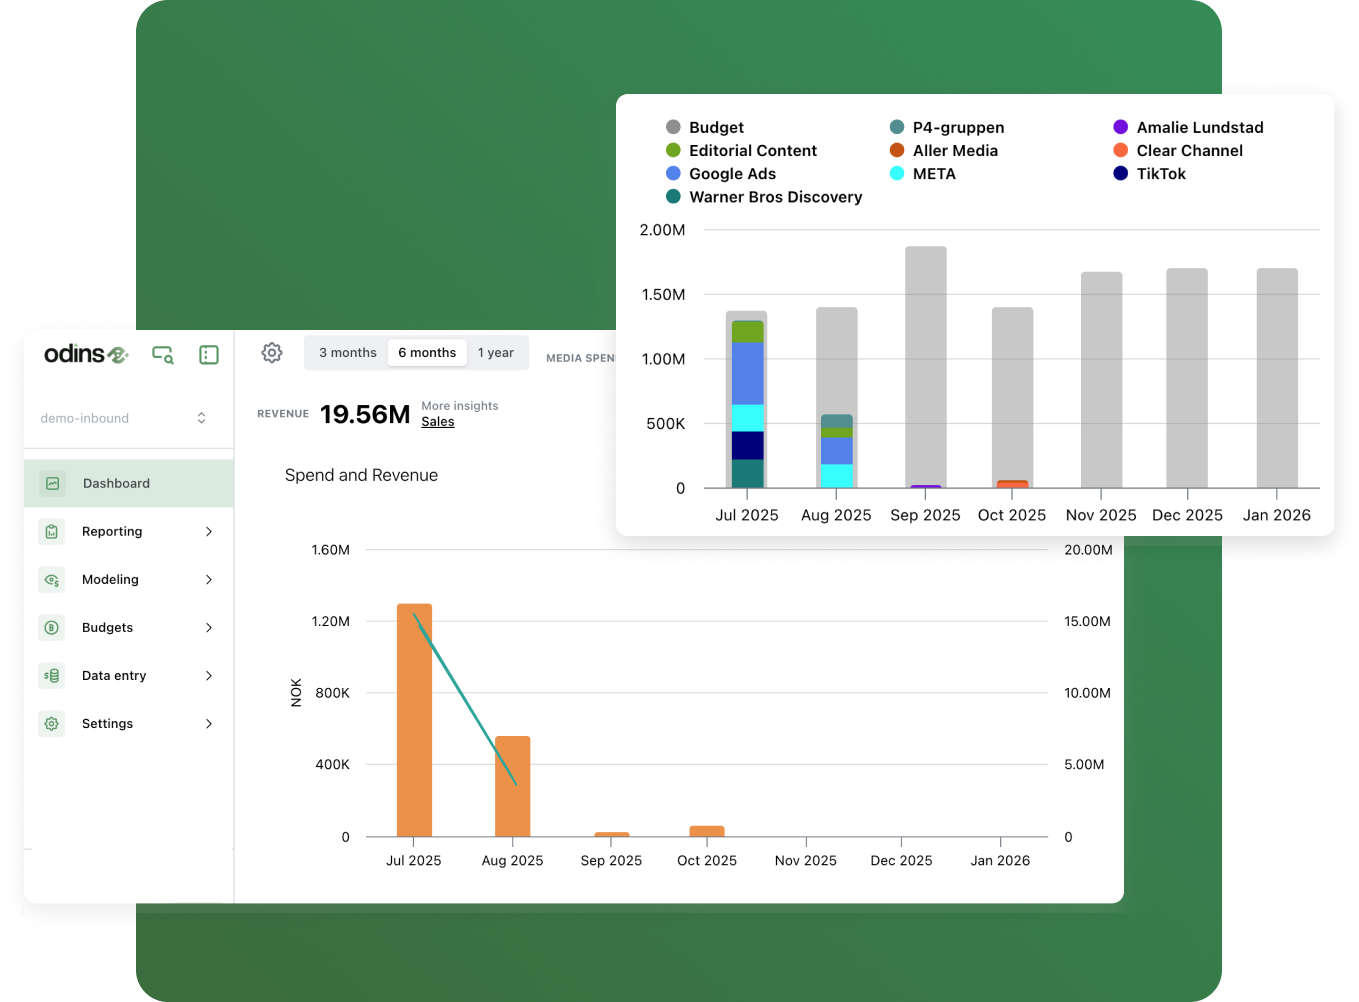
Channel contribution
How much each channel actually drove in the past period — measured independently, not using platform-reported numbers.
Saturation analysis
Where each channel sits on its curve. Which ones have room to grow, which have peaked, and where the marginal ROAS is highest.
Budget optimization
The ideal allocation for your total budget. Or: the right total budget for your target return. Both directions work.
Scenario projections
What happens if you increase budget by 20%? Cut TV? Launch in a new market? Model-backed answers with confidence ranges.
Why we use Bayesian statistics — and why it matters for your results
Odins uses Bayesian marketing mix modeling — not traditional regression. The short version: Bayesian models let you start with expert knowledge and refine it with data, rather than demanding the data prove everything from scratch.
This is especially important outside the United States, where you typically have one national time series instead of 50 state-level datasets. We've written a detailed page explaining the difference.


"What about Google's own attribution?"
Platform attribution only sees one channel. MMM measures all channels simultaneously — giving you an independent view of what actually drives results.

"Can the model handle new channels with no history?"
Yes, with wider uncertainty. The structured test plans help you design experiments to narrow that uncertainty quickly and cost-effectively.

"How do you handle branded search?"
Branded search often gets credit for demand other channels created. The model disentangles this — measuring what paid search drives incrementally beyond organic demand.